
A USD 4.39 billion revenue operations market in 2024, projected to reach USD 16.98 billion by 2033, tells CEOs something counterintuitive: the market is funding RevOps, yet many engagements still stop at dashboards and CRM configuration. Grand View Research estimates the market's projected growth, but the work only earns its place in the budget when it changes how marketing, sales, and customer success make revenue decisions.
At Stimulead, we treat revenue operations consulting as a measurable operating-model engagement. Tools matter, but pipeline coverage, forecast reliability, conversion movement, and retention signals determine whether the work created value.
Table of Contents
- The Problem Most Revenue Operations Consulting Actually Solves
- What Revenue Operations Consulting Aligns Across the Funnel
- The KPIs a RevOps Engagement Should Move First
- Comparing the Three Common Engagement Scopes
- How a Growth-Stage RevOps Engagement Should Run
- Where Revenue Operations Consulting Quietly Fails
- How to Decide If Your Company Needs It Now
The Problem Most Revenue Operations Consulting Actually Solves
Most RevOps consulting is sold as a tooling project. Buyers are usually paying for something more specific, reduced friction between marketing, sales, and customer success.
That friction appears in familiar ways. Marketing reaches its MQL target while qualified pipeline coverage sits at 1.4x, sales overrides lead scores because the scoring model doesn't match rep judgment, and customer success sees churn rise because expansion signals never reach account owners. The CRM may contain plenty of records, yet each team works from different definitions and incentives.
This is an operating-model failure. A new Salesforce report won't fix a disputed lifecycle stage. A HubSpot workflow won't solve a sales and marketing service-level agreement that nobody owns. A customer success dashboard won't create an expansion process if account ownership ends at closed-won.
Practical rule: Start with the revenue decision that currently requires argument, spreadsheets, or manual reconciliation. Then trace the data, process, and ownership behind it.
The modern RevOps discipline brought sales operations, marketing operations, and customer success operations into one management layer. A market overview places the term's mainstream adoption around 2017 to 2019 and describes Forrester's 2019 framing around planning, process, technology, data, and measurement. That history is documented by Spuriq, but the practical lesson matters more than the label: revenue coordination became a growth-management responsibility.
We also see teams overinvest in data tools before agreeing on the data model. Agentic analytics data tools can help teams connect fragmented information, and PlotStudio AI's guide to agentic analytics data tools is useful background for evaluating that layer. Still, integration can't compensate for unclear ownership or inconsistent stage exit criteria.
A consulting proposal should therefore begin with the operating failure. The relevant question is whether the engagement will improve pipeline inspection, forecast decisions, lead routing, handoffs, or retention visibility. Our sales and marketing alignment work follows that sequence rather than starting with a platform migration.
What Revenue Operations Consulting Aligns Across the Funnel
Revenue operations consulting connects marketing operations, sales operations, and customer success operations to one revenue model. Each function keeps its specialist responsibilities, while the company agrees on shared definitions, shared data, and shared decisions.
Marketing operations owns campaign and lifecycle mechanics. Sales operations manages territories, opportunity stages, forecasting, and rep workflows. Customer success operations manages onboarding, health signals, renewals, and expansion processes. The consulting work creates the interfaces between them.

The shared model comes first
A useful operating model defines:
- ICP and segmentation: Marketing, sales, and CS use the same account criteria for prioritisation, territory design, and expansion planning.
- Lifecycle stages: The company documents what changes an account from lead to MQL, SQL, opportunity, customer, and expansion candidate.
- Pipeline definitions: Leadership agrees on whether coverage uses total or weighted pipeline, which opportunities qualify, and which dates count.
- Attribution rules: Teams know how sourced, influenced, and closed revenue are reported without allowing attribution debates to replace decision-making.
- Handoff contracts: Marketing-to-sales and sales-to-CS transfers include required context, ownership, response expectations, and escalation paths.
The typical deliverable is a documented operating model, not a collection of screenshots. It should include ownership maps, data contracts between systems, stage definitions, decision rights, and a governance cadence for resolving exceptions.
One valuable test is to follow a single account from first interaction through onboarding and renewal. If the record changes definition at every handoff, the company has a process problem that no dashboard can conceal for long. Teams working on sales pipeline optimization can use the same account-level test to find where conversion and ownership break.
The final connection is closed-loop reporting. Marketing needs to see which qualified accounts become opportunities. Sales needs to know whether opportunity quality matches the ICP. CS needs the original deal context and product signals so retention and expansion feedback reaches acquisition teams. That loop gives leadership a shared basis for investment decisions.
The KPIs a RevOps Engagement Should Move First
A credible engagement names the few operating measures that must change. Pipeline coverage and forecast quality usually come before dashboard volume because they shape hiring, spend, quota decisions, and board communication.
Pipeline coverage is pipeline value divided by the revenue target. RevOps guidance commonly places healthy coverage near 3:1 for many B2B motions, while enterprise motions may require 4:1 or higher because of longer cycles and lower win rates. Entering a quarter below roughly 2.5:1 is a strong warning sign. ZoomInfo's RevOps growth guidance explains the coverage logic.
Coverage alone can mislead. A company can inflate the number with old opportunities, weak qualification, or deals sitting in late stages without buyer activity. The operational levers are stage exit criteria, opportunity aging rules, ICP fit, lead routing, and a documented definition of weighted pipeline.
Forecast accuracy is the second major test. Spreadsheet-based forecasting is commonly reported at 45% to 55% accuracy, while AI-assisted forecasting is often reported at 90% to 95%, though those figures depend on data quality, definitions, and implementation. The benchmark summary from Stealth Agents also notes that only about 20% of sales organisations forecast within 5% of plan, while sub-10% MAPE is considered strong for many B2B teams.
AI can't repair missing close dates or inconsistent stage usage. We first tighten required CRM fields, lead routing, stage definitions, probability rules, and manual override governance. Only then can a forecasting model distinguish genuine risk from stale data.
Pipeline velocity combines opportunities, average deal size, win rate, and sales cycle length:
(Opportunities × Average Deal Size × Win Rate) ÷ Average Cycle Days
Fairview's RevOps dashboard guidance describes this as a dollars-per-day measure and notes that declining velocity can appear before a quarter-end miss becomes obvious. The useful intervention may be better qualification, faster progression, fewer stalled deals, or improved win rate. Speed-to-close alone is too narrow.
| KPI | Starting Range | Target | Operational Lever |
|---|---|---|---|
| Pipeline coverage | Below healthy coverage | Approximately 3:1 for many B2B motions, 4:1 or higher for some enterprise motions | Qualification, stage exit criteria, pipeline generation |
| Forecast accuracy | Spreadsheet-led forecasts commonly reported at 45% to 55% | AI-assisted benchmarks commonly reported at 90% to 95%, subject to data quality | CRM completeness, probability rules, forecast governance |
| Pipeline velocity | Declining dollars per day | Positive movement in opportunity count, win rate, deal size, or cycle length | Deal aging, routing, qualification, conversion |
| Funnel progression | Unknown or disputed stage rates | Baseline and improve each stage transition | Lifecycle definitions and source tracking |
| Retention visibility | Expansion and churn signals arrive late | Earlier account-owner action | CS handoff triggers and health data |
The supporting measurement stack should include lead response time, lead-to-MQL, MQL-to-SQL, SQL-to-opportunity, stage aging, sales cycle length, and closed-won to onboarding kickoff. Rework's RevOps metrics library provides a useful reference for mapping those intervals.
For teams building a broader measurement system, this measurement in marketing guide offers helpful context on connecting activity metrics to business outcomes. Our own guide to measuring marketing effectiveness uses the same principle: the metric should support a decision.
A proposal without numeric baselines and target movements is process documentation with consulting language around it.
Comparing the Three Common Engagement Scopes
The right scope depends on what the company needs to learn, change, or keep running. A diagnostic answers questions. An implementation changes the system. A fractional engagement adds ongoing ownership and creates enough operating history to examine retention and expansion.
The duration and fee ranges below are common commercial structures, not universal pricing. Complexity, CRM architecture, data remediation, and executive access can change the commercial model.
| Dimension | Diagnostic | Implementation | Fractional |
|---|---|---|---|
| Typical duration | 4 to 6 weeks | 3 to 9 months | 6 to 12 months |
| Typical price range | $25K to $75K | Scope-based, often higher as systems and teams change | Monthly part-time engagement |
| Main deliverable | Written assessment and prioritised fixes | Process, CRM, data, and rollout changes | Senior operating ownership and recurring execution |
| Best for | Finding the constraint | Changing the operating system | Sustaining governance and measuring retention |
| Can prove | Baselines, causes, and opportunity size | Pipeline and forecast movement at handoff | Retention, expansion, adoption, and governance over time |
| Cannot prove | Revenue impact from changes not yet made | Long-term retention effect after handoff | Results without executive sponsorship and internal adoption |
A diagnostic is the correct first purchase when leadership can't agree on the problem. It should reconcile CRM data, interview the teams, map the funnel, and rank fixes by expected decision value. It shouldn't pretend that a written roadmap caused a change in revenue.
An implementation makes sense when the company has a known failure and enough internal authority to change process. Salesforce, HubSpot, Marketo, Outreach, Gong, and Gainsight may all be involved, but the stack is secondary to ownership and adoption. The handoff should include baseline values, new definitions, training, and a review date.
Fractional support is different. The operator attends pipeline reviews, challenges forecast assumptions, maintains quota and attainment reporting, and ensures that customer success signals reach the revenue team. This is the only scope that can credibly examine whether operating changes affect retention and expansion over time.
A vendor that promises all three outcomes under one vague scope has probably avoided defining success.
How a Growth-Stage RevOps Engagement Should Run
Consider a representative Series B B2B SaaS company with $20M ARR, $2.4M in marketing spend, and a 50-person sales team. It has roughly 70% quota attainment and 2.0x pipeline coverage against a 3.0x target. These figures describe an illustrative operating scenario, not a client result.
The engagement shouldn't begin with a dashboard redesign. It starts with a two-week diagnostic that maps the funnel, reconciles CRM objects, checks account and opportunity duplication, and establishes conversion baselines by stage and segment.

The first eight weeks establish the target state
During the next phase, the team turns findings into operating decisions:
- Rewrite lead routing against the ICP. Routing rules should use account fit, territory, ownership, and buying context rather than a generic round-robin queue.
- Refresh the qualification gate. Marketing-qualified and product-qualified naming conventions should be reconciled so sales knows which action each signal requires.
- Rebuild account segmentation. Segmentation should support territory planning, account prioritisation, and customer expansion rather than exist only in a marketing report.
- Document stage exit criteria. An opportunity advances when evidence exists, not when a representative needs a healthier-looking forecast.
CRM mechanics make the model enforceable. Required fields can block stage advance. Validation rules can stop incomplete opportunity records. Salesforce flows or HubSpot automation can create handoff tasks. Gong or Clari can support deal inspection, while Gainsight can feed customer health signals into expansion reviews.
The engagement then moves into governed execution. Weekly pipeline reviews record slip reasons and distinguish genuine movement from date changes. Monthly forecast calls compare probability-weighted commit with the underlying opportunity evidence. Quarterly business reviews examine retention cohorts and the quality of the sales-to-CS handoff.
The company should track attainment movement alongside the operating metrics. If coverage rises but stage conversion falls, the team may be adding low-quality pipeline. If forecast accuracy improves while retention signals remain invisible, the work has fixed planning without fixing the full revenue system.
The governance pack should name the meeting owner, decision rights, escalation path, baseline, target, and sign-off requirement for decisions that can't proceed autonomously. Without those controls, implementation becomes a series of tickets and the original operating problem returns after the consultant leaves.
Where Revenue Operations Consulting Quietly Fails
Healthy-looking engagements fail when the team treats implementation activity as evidence of operating change. Four failure modes appear repeatedly.
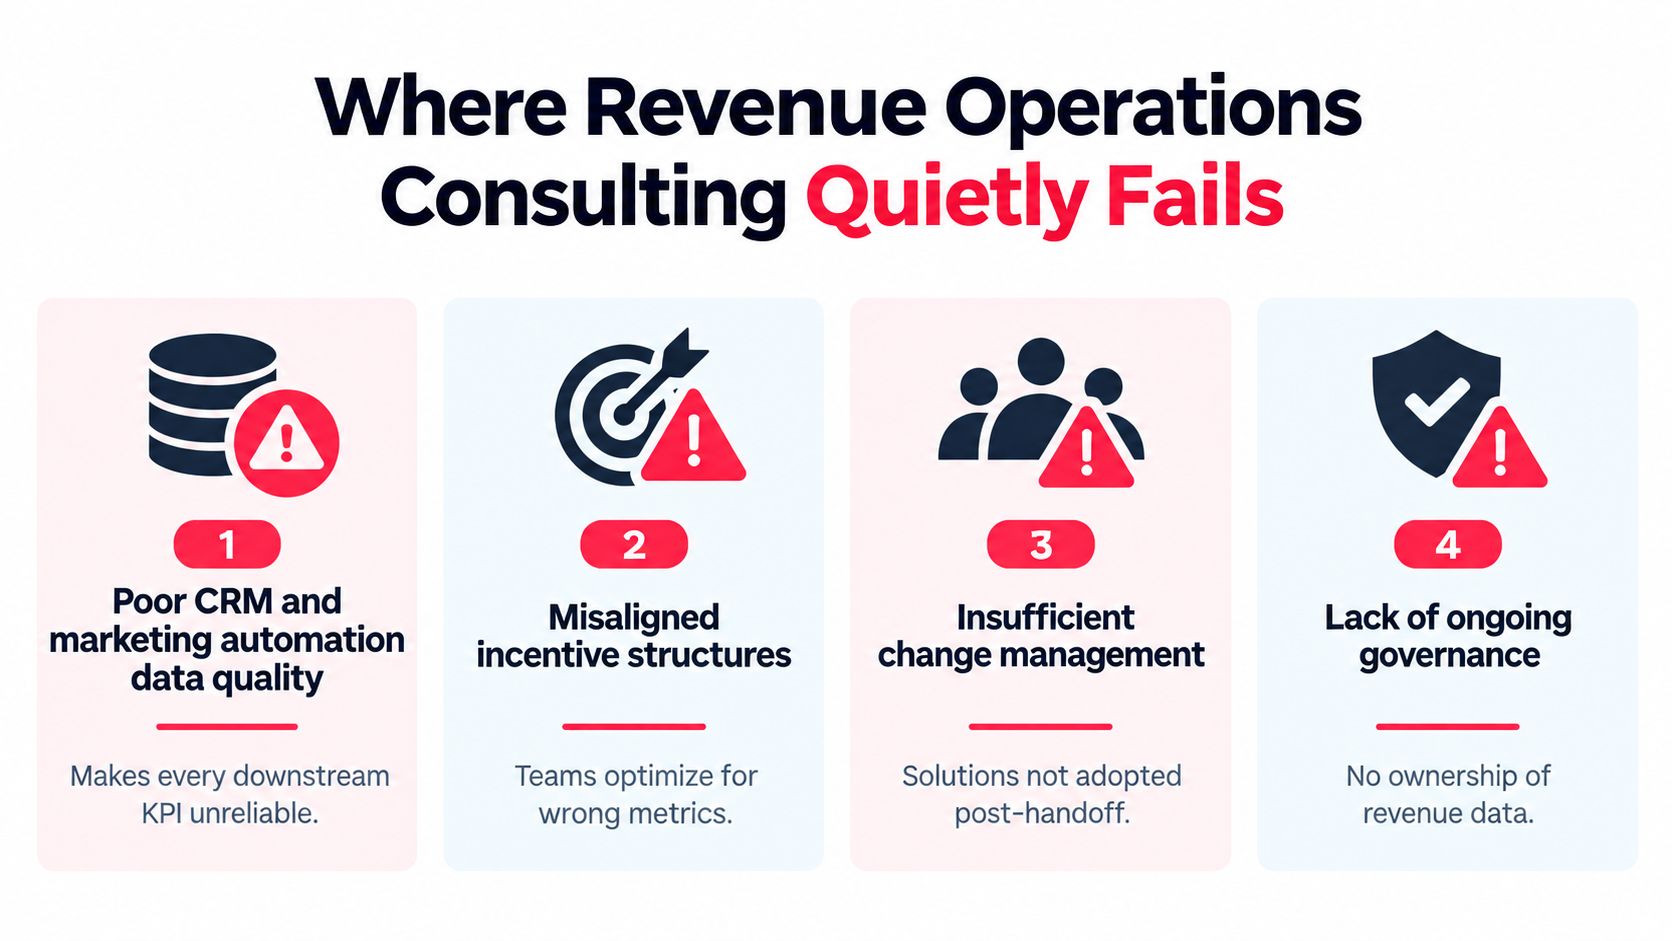
Poor CRM and marketing automation data quality comes first. If opportunity stages, source fields, close dates, or account ownership are unreliable, downstream conversion and forecast metrics are unreliable too. The early signal is simple: two executives request the same number and receive different answers.
No clear strategic goals turns the work into a tooling exercise. A 2025 Wakefield study found that 89% of respondents said RevOps lacked clearly defined strategic goals, while 87% planned increased investment. Salesloft's summary of the study reports that buyers prioritised clarity at 64%, better tools at 62%, and decision-maker access at 62%. A dashboard has no executive value if nobody can state which decision it changes.
AI before operating-model readiness creates false confidence. A 2025 multi-country RevOps report found that 75% of respondents had never used AI for reporting, 53% preferred custom-built tools, and 5x more respondents rated their data quality as poor rather than excellent. Revenue Wizards documents those findings. Predictive forecasting and intent scoring amplify inconsistent stages when the data model and ICP aren't documented.
No governance after handoff leaves ownership unclear. The same report found that 23% of respondents were solo RevOps practitioners even in companies with 1,000+ employees, a signal that one operator can become a bottleneck when leadership hasn't defined decision rights and capacity. A fractional operator can provide senior direction, but the engagement still needs executive sponsorship, internal owners, and a recurring review cadence.
How to Decide If Your Company Needs It Now
Treat the decision as a fit test, not a vendor shortlist. Look for operating signals that your current model can't explain or control.
| Signal | Threshold | Suggested Engagement |
|---|---|---|
| Pipeline coverage | Below 3x for the next quarter | Diagnostic, then implementation if causes are confirmed |
| Forecast variance | Above 15% | Diagnostic focused on data, stages, and commit rules |
| Marketing-to-SDR handoff | Leads are lost, delayed, or disputed | Targeted implementation |
| Retention and expansion | CSAT movement accompanies NRR drift | Fractional engagement with CS governance |
| CRM data quality | Reporting requires manual reconciliation | Diagnostic before automation or AI |
Mark each signal yes or no. Three or more yes answers indicate a broad operating-model problem worth assessing across functions. One or two usually point to a targeted diagnostic or fractional operator rather than a full transformation.
Don't use a readiness checklist as a substitute for evidence. Pull the last four quarters of pipeline coverage, forecast accuracy, and net revenue retention into a simple table. Add the definitions used for each metric, because disagreement about definitions is itself a finding.
Then book a diagnostic before approving an implementation. The diagnostic should return a prioritised failure map, baselines, recommended scope, governance design, and a decision about whether AI belongs in the first release.
This week, export the last four quarters of coverage, forecast accuracy, and NRR, write down how each metric is defined, and bring that table to a Stimulead diagnostic before you approve another CRM or dashboard project.
