
The popular advice is to improve the algorithm. In our work with growth-stage B2B companies, churn prediction models usually fail for a less technical reason: the team optimizes a score that customer success can't turn into a profitable action.
A model can rank accounts well and still produce no retention value if the CSM team has no capacity, the threshold flags too many accounts, or the intervention costs more than the customer is worth. For CEOs, CMOs, and CROs, the decision isn't which model wins a benchmark. It's whether the operating system around the model can save the right accounts quickly enough.
Table of Contents
- Why Most Churn Prediction Models Fail in Production
- How Churn Modeling Evolved From Telecom to Tabular Foundation Models
- Feature Engineering Moves Models From Mediocre to Production-Ready
- Evaluation Metrics That Connect Predictions to Retention Action
- Profit-Driven Evaluation Replaces Accuracy Benchmarks
- Deployment and Monitoring as a Revenue System
- Where Churn Programs Collapse and What to Do Instead
Why Most Churn Prediction Models Fail in Production
High accuracy can hide an unusable retention program. Decision trees and random forests have produced strong accuracy results on simpler churn tasks, but that score does not tell a CRO whether the highest-risk accounts can be contacted during the intervention window or whether outreach will repay its cost. Research comparing methods across industries includes decision trees, random forests, and neural networks, yet algorithm rankings remain separate from operating constraints.
The failure usually appears after the notebook. Data science produces a probability score or ranked export. Customer success receives more accounts than it can work, sales operations lacks a routing rule, and finance has not agreed on the value of a saved customer or the cost of an offer. The model may be statistically sound while the company runs a prediction report instead of a decision system.
Practical rule: If you cannot name the owner, response time, intervention, and success measure for each risk tier, you are not ready to judge the model.
Evaluate churn as ranking plus resource allocation. The output should separate accounts that deserve scarce human attention from those suited to automation or no intervention. A churn prediction model explained resource can clarify the mechanics, but technical understanding will not solve an overloaded CSM queue.
Stimulead's work connecting model output with lifecycle and conversion testing reflects a useful operating pattern. Retention interventions need controlled experiments, defined cohorts, and measurement that distinguishes correlation from customers saved. Teams can apply the same discipline through an AI testing framework, without treating the model score as proof that an intervention works.
Start with capacity. How many accounts can the team contact during the intervention window? If the answer is a finite queue, evaluate the model at that queue size and compare the resulting actions with their cost and expected value. A model that ranks the first group of workable accounts well can create more retention value than one with a stronger overall accuracy score.
How Churn Modeling Evolved From Telecom to Tabular Foundation Models
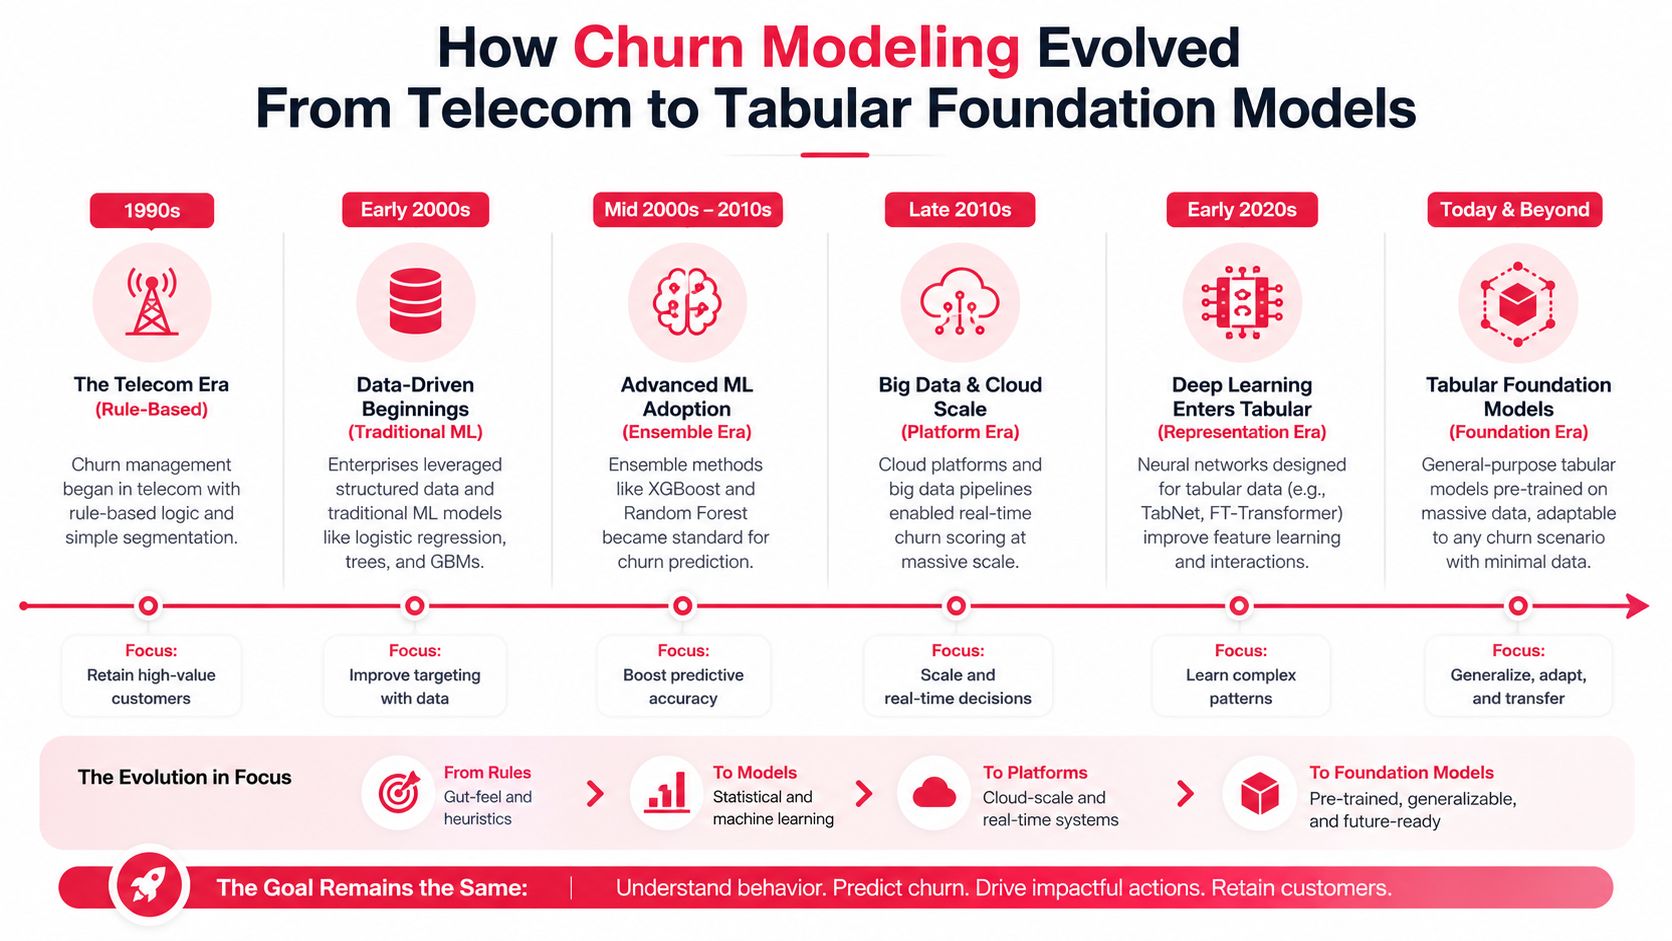
Churn prediction has a longer history than the current AI cycle. Customer lifetime value models began incorporating churn rates into profitability forecasting by 1988, while later work established decision trees, logistic regression, support vector machines, negative binomial methods, and survival analysis as ways to model customer behavior and expected value, according to the 2025 survey of churn prediction research.
Telecom datasets helped make classification a standard operating pattern. The practical shift was important: teams moved from estimating aggregate customer value to identifying individual accounts that appeared likely to leave. Recent work now spans CNNs, RNNs, LSTMs, uplift modeling, explainable AI, and benchmark datasets across sectors.
For a growth-stage B2B company, the operational question is simpler than the research history. What does your data look like, and where will the next useful lift come from?
| Current setup | Sensible next question |
|---|---|
| Logistic regression on clean, well-defined fields | Are the features capturing behavior and change over time? |
| Random forest or XGBoost on flat tables | Can the model rank the intervention queue better? |
| Several bespoke models across products | Can common customer and event structure be represented consistently? |
| Strong offline metrics, weak retention results | Is the intervention causing incremental saves? |
A 2026 cross-industry benchmark evaluated 16 churn models across nine public datasets and seven sectors. Tabular foundation models outperformed classical, deep-learning, and tree-ensemble baselines collectively, while TabICL v2 ranked in the top three on eight of nine datasets and beat XGBoost by up to 9.23 percentage points in PR-AUC without dataset-specific retraining. Those results come from the ICML 2026 benchmark, and they suggest that teams already tuning tree models may eventually gain more from cross-table structure than from another round of parameter adjustments.
That doesn't make a foundation model an automatic purchase. A model that can't be explained to a CSM, scored reliably, or connected to a CRM workflow adds technical debt. Before assessing whether your company is ready for a more advanced stack, use Stimulead's AI readiness assessment to examine data access, ownership, workflow maturity, and measurement discipline.
Feature Engineering Moves Models From Mediocre to Production-Ready
Feature quality often matters more than algorithm selection. One published guide reports roughly 65% to 70% accuracy before feature engineering and 85% to 92% after behavioral signals are added, including usage patterns and engagement changes. Treat those figures as directional evidence from that source, not as a promise for your dataset. The underlying point is sound: raw transaction logs rarely describe the customer's current relationship with the product.
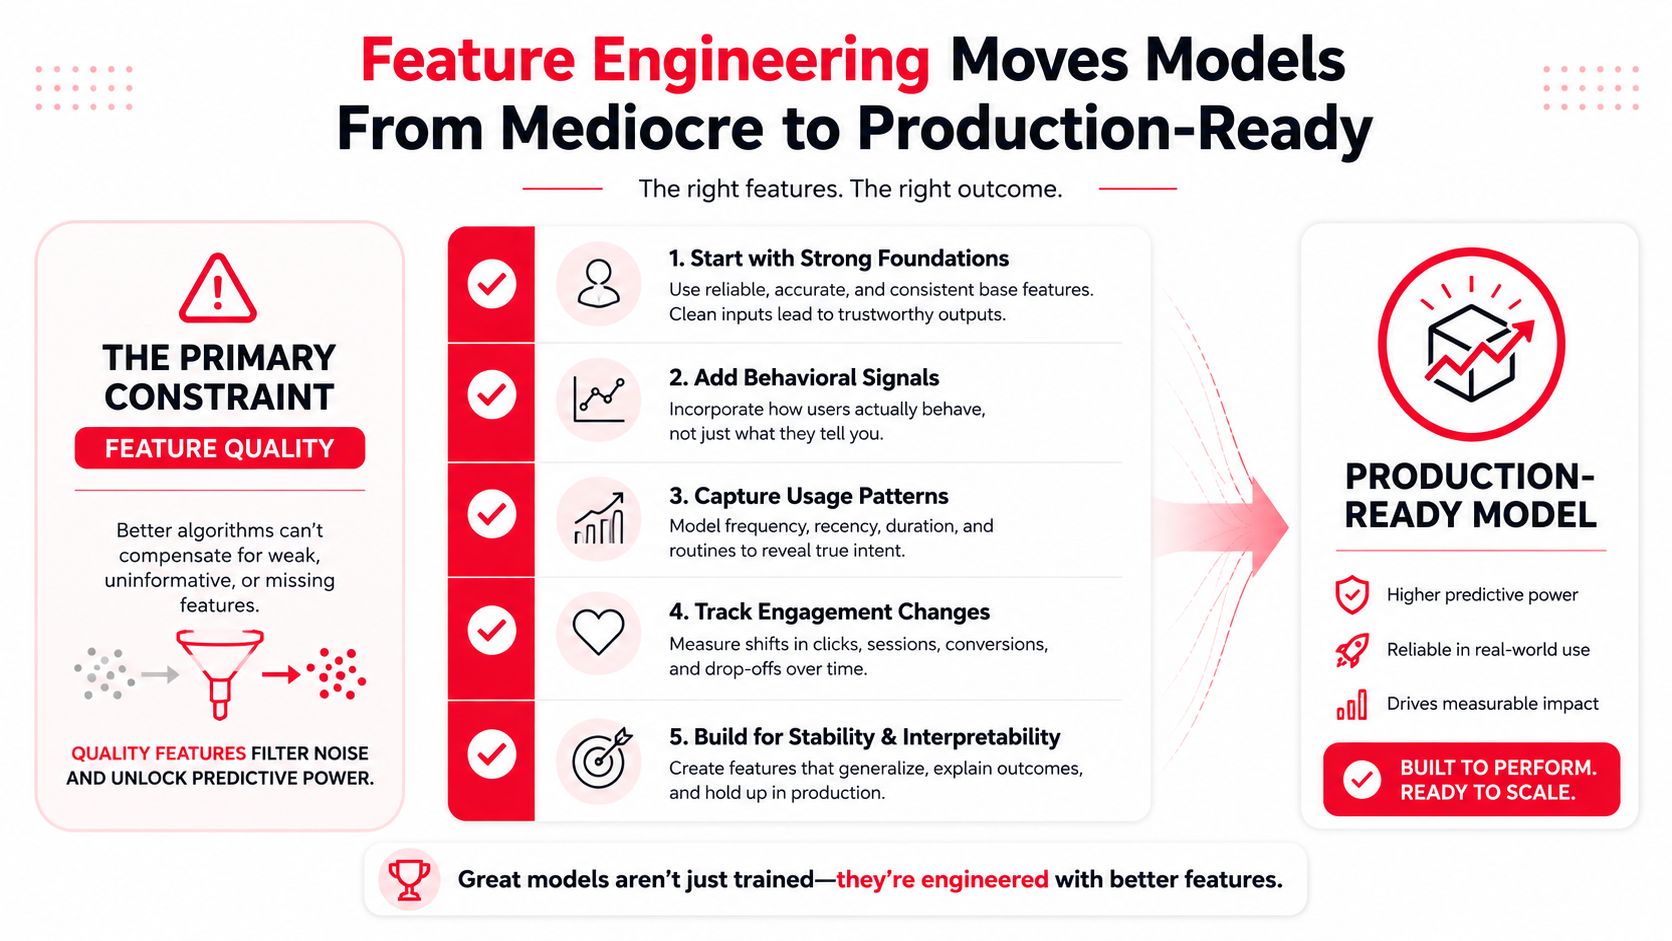
For B2B SaaS, we start with signals that a CS or product team can interpret:
- Login frequency decay: Compare recent activity with the account's established usage pattern. A fall matters more than a low absolute number for a customer whose normal usage was already modest.
- Feature adoption plateaus: Track whether the account stopped progressing after initial activation. A customer using one narrow workflow may have little perceived switching cost.
- Support sentiment shifts: Rising frustration, repeated issues, or slower resolution patterns can matter more than total ticket count.
- Contract engagement timing: Renewal proximity, executive meeting attendance, and stakeholder participation provide context for a usage change.
- Usage concentration: If activity is shrinking to a small group of users, the account may be becoming single-threaded and more exposed to one champion leaving.
A practical feature pipeline starts with a shared definition document. Customer success specifies which behaviors indicate value, data engineering identifies the source tables, and revenue operations maps each feature to an account or subscription record. Store the calculation logic with the feature, including its time window and refresh cadence. Otherwise, the feature will mean something different in training, validation, and production.
The sequence matters:
- Audit availability. List product events, billing records, support data, CRM fields, and renewal dates. Mark fields that arrive after the churn decision would need to be made.
- Create time-based features. Use recent activity, prior activity, and directional change. Avoid features that leak the eventual cancellation.
- Separate behavior from diagnosis. A falling login rate is a signal. A CSM's later cancellation note is an outcome or explanation, not a legitimate early predictor.
- Validate with operators. Ask CSMs whether each feature can support a conversation or action.
- Version the pipeline. Keep feature definitions stable enough to compare model versions and intervention tests.
A logistic regression with maintainable behavioral features can outperform a neural network trained on unstructured logs when the latter lacks useful representation and clean labels. Teams building a signal library can also review Stimulead's signal-based selling approach for a related method of turning account behavior into timely commercial action.
Evaluation Metrics That Connect Predictions to Retention Action
AUC is useful, but it doesn't tell the team where to operate. The ROC curve sweeps the decision threshold from high to low, and AUC summarizes ranking skill on a 0 to 1 scale, with 0.5 representing chance-level ordering and values below 0.5 indicating reversed scoring direction, as explained in this classification and churn modeling reference.
Production teams don't sweep every threshold. They choose one operating point, or several, based on the number of accounts they can reach and the cost of each action. In imbalanced churn data, PR-AUC is often more informative because it focuses attention on precision and recall for the rare positive class.
| Metric | Best when | Limitation |
|---|---|---|
| ROC-AUC | You need a broad view of ranking across thresholds | It can look healthy when precision near the top of the queue is weak |
| PR-AUC | Churn is relatively rare and campaign capacity is limited | It changes with the underlying churn rate, so comparisons need cohort context |
| Precision | A CSM call, discount, or executive escalation has meaningful cost | A high score may come from missing many actual churners |
| Recall | The intervention is cheap and missing a risk signal is expensive | Lower thresholds can produce too many false positives |
| Precision at top-k | The team can work only a fixed number of accounts | It says little about customers outside the selected queue |
| Calibration | The business needs probabilities for expected-value decisions | A calibrated score still doesn't prove the intervention caused retention |
Thresholds change the economics. In one churn study, a 0.528 threshold balanced precision at 0.90 and recall at 0.91 while reducing false negatives by 15%, according to the published threshold analysis. That operating point isn't portable to your company. It demonstrates why a default 0.5 threshold is a technical convenience, not a business decision.
Lowering the threshold catches more actual churners and creates more false positives. Raising it reduces the queue and may improve precision while missing customers who need help. The definitions and trade-off are set out in this precision and recall guide.
For broader retention context, teams can also compare the business logic in this guide to predictive analytics for ecommerce retention. The sector differs, but the operating question remains the same: which prediction triggers an action that can be measured?
Profit-Driven Evaluation Replaces Accuracy Benchmarks
A churn prediction model should earn its place through incremental retention profit, not a leaderboard position. Recent reviews identify inconsistent use of intervention cost, retention ROI, profit-driven metrics, and adaptive learning in real-world churn deployment. One review of 240 studies from 2020 to 2024 describes growing interest in ensembles, deep learning, and explainable AI while still identifying profit-oriented evaluation as a gap, as reported in this recent review.
The break-even calculation is straightforward:
Expected value per flagged account = probability of a save × contribution value of the saved customer minus intervention cost.
Use contribution value rather than headline contract value when possible. If the customer is worth less than the fully loaded cost of the intervention, the model should route that account to a cheaper channel or leave it unworked. The exact break-even precision depends on your save value, intervention cost, and whether the action creates discount leakage or service capacity costs.
A practical decision test
Build a table for each intervention tier with:
- expected customer contribution if retained
- cost of CSM or executive time
- discount or incentive cost
- channel cost
- expected save rate
- capacity available during the risk window
Then compare model versions on the same operating threshold. A model with lower accuracy can still win if it identifies accounts that respond to the available intervention. That requires a holdout or randomized treatment design where feasible, because customers who receive outreach may differ from customers who don't.
A model that predicts churn without predicting response to intervention has a ceiling. Uplift modeling addresses that gap by asking which customers are more likely to stay because of a treatment, rather than merely which customers appear risky. The first publicly available telecom churn uplift dataset, built with Orange Belgium data, marked a useful step toward treatment-aware evaluation, according to the 2023 benchmark paper.
Complexity earns its cost when customer behavior is high-dimensional, relational, or difficult to represent in a flat table. Simpler models remain competitive when features are clean and the decision needs to be transparent. We recommend choosing the least complex model that produces a profitable, repeatable intervention process, then increasing complexity only when the current system has a measured limitation.
Deployment and Monitoring as a Revenue System
A churn model creates revenue only when its output reaches the right owner while an intervention can still change the account's outcome. Production deployment therefore needs four owners: data engineering for the pipeline, data science for model quality, revenue operations for CRM routing, and customer success leadership for intervention design. Without those responsibilities, the model becomes another dashboard that leaves operators to interpret risk manually.
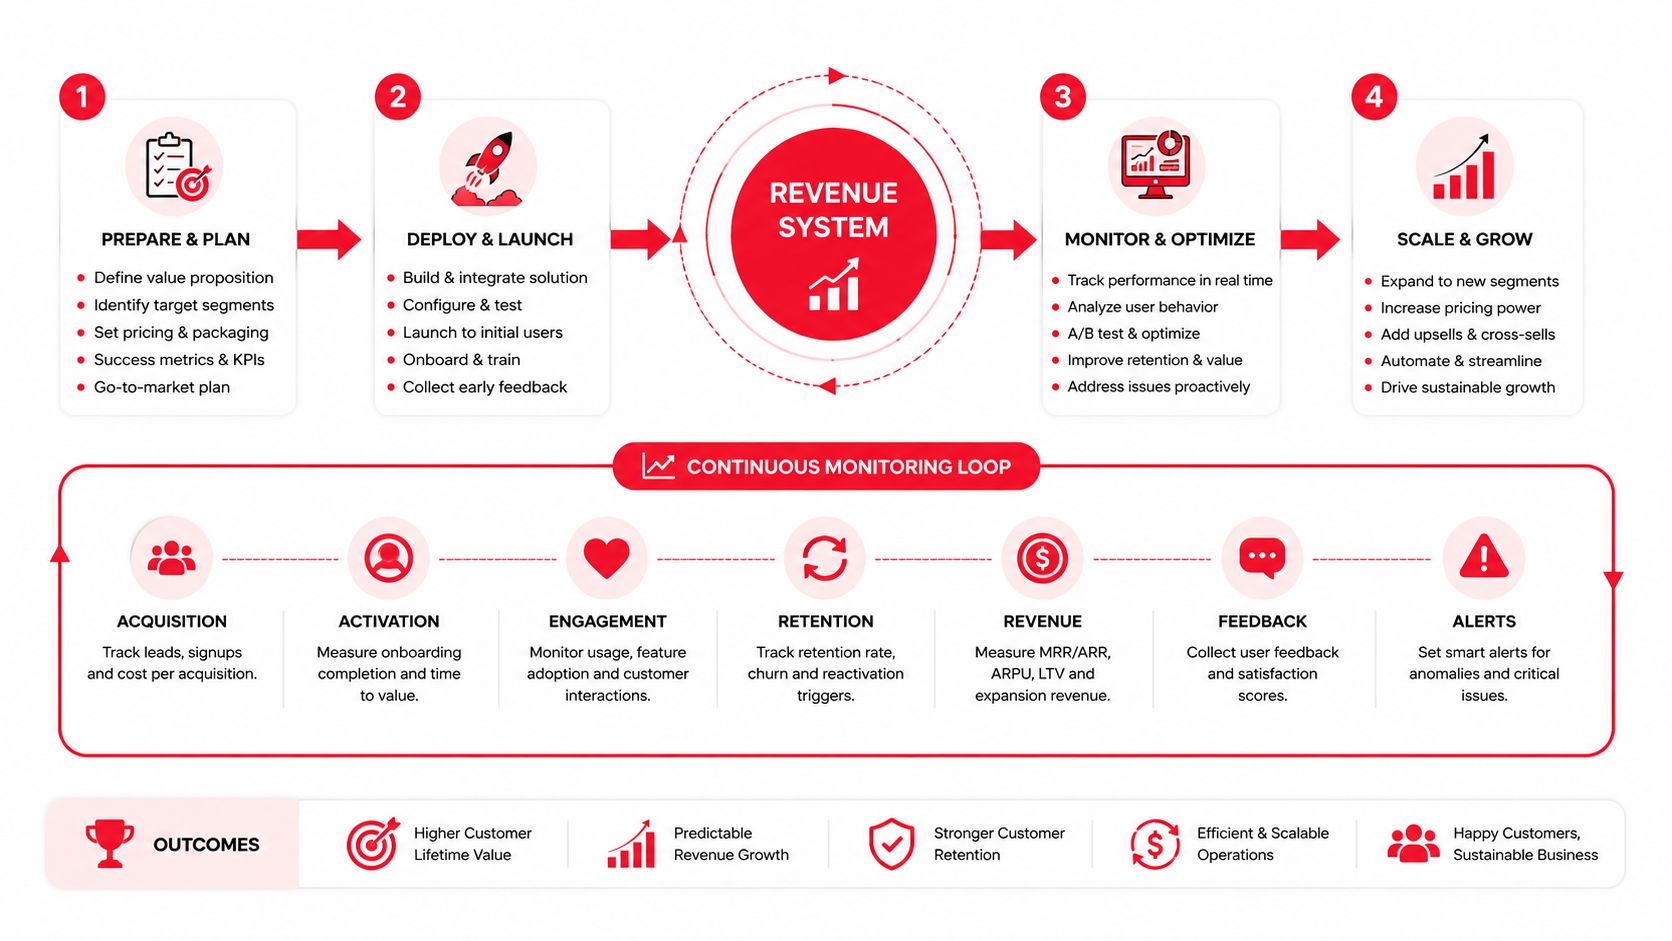
Use a staged deployment:
- Define the event. Agree on what counts as churn, the prediction horizon, and the point when a signal becomes actionable.
- Score and route. Write the score, risk tier, leading signals, and recommended action into Salesforce, HubSpot, or another CRM.
- Set service levels. Assign urgent signals to an owner with a response deadline. Send lower-cost signals to automated email or in-product workflows.
- Capture outcomes. Record contact, acceptance, decline, save, churn, expansion, and no-response outcomes in structured fields.
- Review drift. Compare feature distributions, score distributions, precision, recall, and save outcomes with the validation period.
Weekly scoring can suit a small SaaS company because it gives customer success a manageable planning rhythm. Higher-value or faster-moving accounts may need more frequent scoring, while slower contract cycles may not justify that effort. Set cadence according to signal decay and intervention timing, not a generic data science schedule.
Monitor the workflow, not only confirmed churn. Missing product events, delayed billing exports, a rise in unknown CRM values, a shift in high-risk account share, and falling contact rates can signal a broken system. A model may retain acceptable evaluation metrics while alerts stop reaching the team.
Retrain only after reviewing outcomes and label quality. Automatic retraining can treat a temporary billing problem, campaign effect, or change in CSM behavior as a stable customer pattern. The operating review should confirm that the labels still represent the business decision and that the team still has capacity to act on the resulting scores.
Where Churn Programs Collapse and What to Do Instead
We see four recurring breakdowns in growth-stage companies.
First, the team treats every signal as equally urgent. A failed payment, a drop in feature use, and a negative executive interaction may all appear in one risk score, but they need different owners and responses. Billing recovery belongs with the billing workflow. A product adoption issue may belong with CS or product education.
Second, the company sends every prediction to one queue. The CSM team receives a spreadsheet, the SDR team receives a duplicate list, and nobody knows which account takes priority. Segment by intervention type, customer value, and signal age before assigning work.
Third, governance stops at model approval. Someone needs authority to change thresholds, pause an intervention, review false positives, and approve discounts. Treat churn signals as testable inputs, not unquestionable alerts. The practical guidance in this overview of AI support and loyalty for ecommerce applies here too, especially the connection between automated signals and human follow-up.
Finally, response arrives after the decision window. A CSM call weeks after usage decay may be polite but ineffective. Match the SLA to the signal, then measure contact rate, acceptance, save rate, retained contribution, and customer experience impact.
Audit the current program before buying another model. Map every signal to an owner, action, deadline, and outcome field. If those four fields don't exist, fix the operating design first, then decide whether a new algorithm can add value.