
Many teams still treat statistical significance like a green light. The dashboard turns positive, the variant ships, and everyone moves on. That's how a lot of “wins” end up adding complexity without moving revenue.
The better move is harder and more useful. Read significance as a check on whether your result is compatible with a null hypothesis, then ask the business question that matters, whether the effect is big enough to justify implementation cost, risk, and lost time. A p-value can tell you that the data look unlikely under no effect, but it can't tell you if the lift pays for the engineering work, the page latency, or the brand trade-off.
For growth leaders, that difference matters every week. A variant can be statistically significant and still be a bad decision. A result can also miss the threshold and still be worth acting on if the effect is large enough and the test was underpowered. That's why the right read is never just “significant or not.”
Table of Contents
- Why a Winning P-Value Does Not Mean a Winning Business Decision
- The Core Mechanics of Statistical Significance Explained
- Effect Size Versus Significance in Conversion Experiments
- Sample Size and Statistical Power for Marketing Tests
- Common Pitfalls That Destroy Test Validity
- Confidence Intervals and Bayesian Alternatives to P-Values
- Embedding Significance Into AI-Driven Experimentation Workflows
Why a Winning P-Value Does Not Mean a Winning Business Decision
A SaaS company can run 40 tests in a quarter, see 12 results turn green, and still move monthly recurring revenue only 3 times. That is the problem with reading statistical significance as a business verdict. A low p-value says the result is hard to explain away as random noise. It does not say the change is worth shipping.
The old rule many teams use still comes from hypothesis testing and the habit of treating 0.05 as a pass-fail cutoff (Britannica, Investopedia). That rule is convenient for reporting, but it is a weak proxy for operator judgment. A small lift can look significant if the sample is large enough, while a large and useful lift can miss the threshold in a smaller test. The p-value only answers one narrow question, and it does not tell you whether the change will pay for itself.
The question a CEO cares about is simpler. Will this variant improve pipeline, revenue, retention, or cost enough to justify the effort of shipping and maintaining it? If the answer is no, the test may still be statistically clean, but it is not a good decision.
Practical rule: use p-values to screen for surprise, then make the ship decision with effect size, confidence, and implementation cost.
AI-driven experimentation makes this harder, not easier. Faster variant generation can create more apparent winners, and that pressure often pushes teams to promote anything that clears a threshold. The result is more activity, not more value.
A stronger standard is to require three checks before you ship. The result has to be statistically credible. The effect has to be large enough to matter in the business. The operational cost has to make sense relative to the expected return. If any one of those fails, the answer stays no.
See the guide to data-driven decisions for a broader framing of how teams should use test results.
The Core Mechanics of Statistical Significance Explained
A clean way to think about statistical significance is to use a landing page test. Variant A is the current page. Variant B changes the headline and form layout. The null hypothesis says there is no real difference between the two pages, and the test starts by trying to disprove that default assumption.
The p-value is the probability of seeing data at least as extreme as your sample result, assuming the null hypothesis is true (Frontiers). If that probability is low, the result is harder to explain as random noise alone. That is all it means. It does not mean the variant is definitely better, and it does not prove causation.
The decision threshold is the alpha level. Many teams set alpha at 0.05, then call results below that threshold significant and results at or above it not significant (NCBI, Britannica). That cutoff is a convention, not a law of nature. It became common because it gave researchers a simple rule for uncertainty, not because 0.05 has special mathematical status.
For a growth team, the clean mental model is this. If your p-value is below alpha, the observed result would be relatively rare if there were no difference. That gives you evidence against the null. It does not tell you whether the lift is large enough to matter, whether the sample was big enough to detect the lift you care about, or whether the result survives a second test.
A useful companion resource here is the guide to data-driven decisions, which frames significance as part of a broader operating discipline rather than a standalone number.
The shortest way to explain it to a team is this. P-value answers, “How surprising is this result if nothing changed?” Alpha answers, “How rare do we require that surprise to be before we call it significant?” The business answer still comes later.
Effect Size Versus Significance in Conversion Experiments
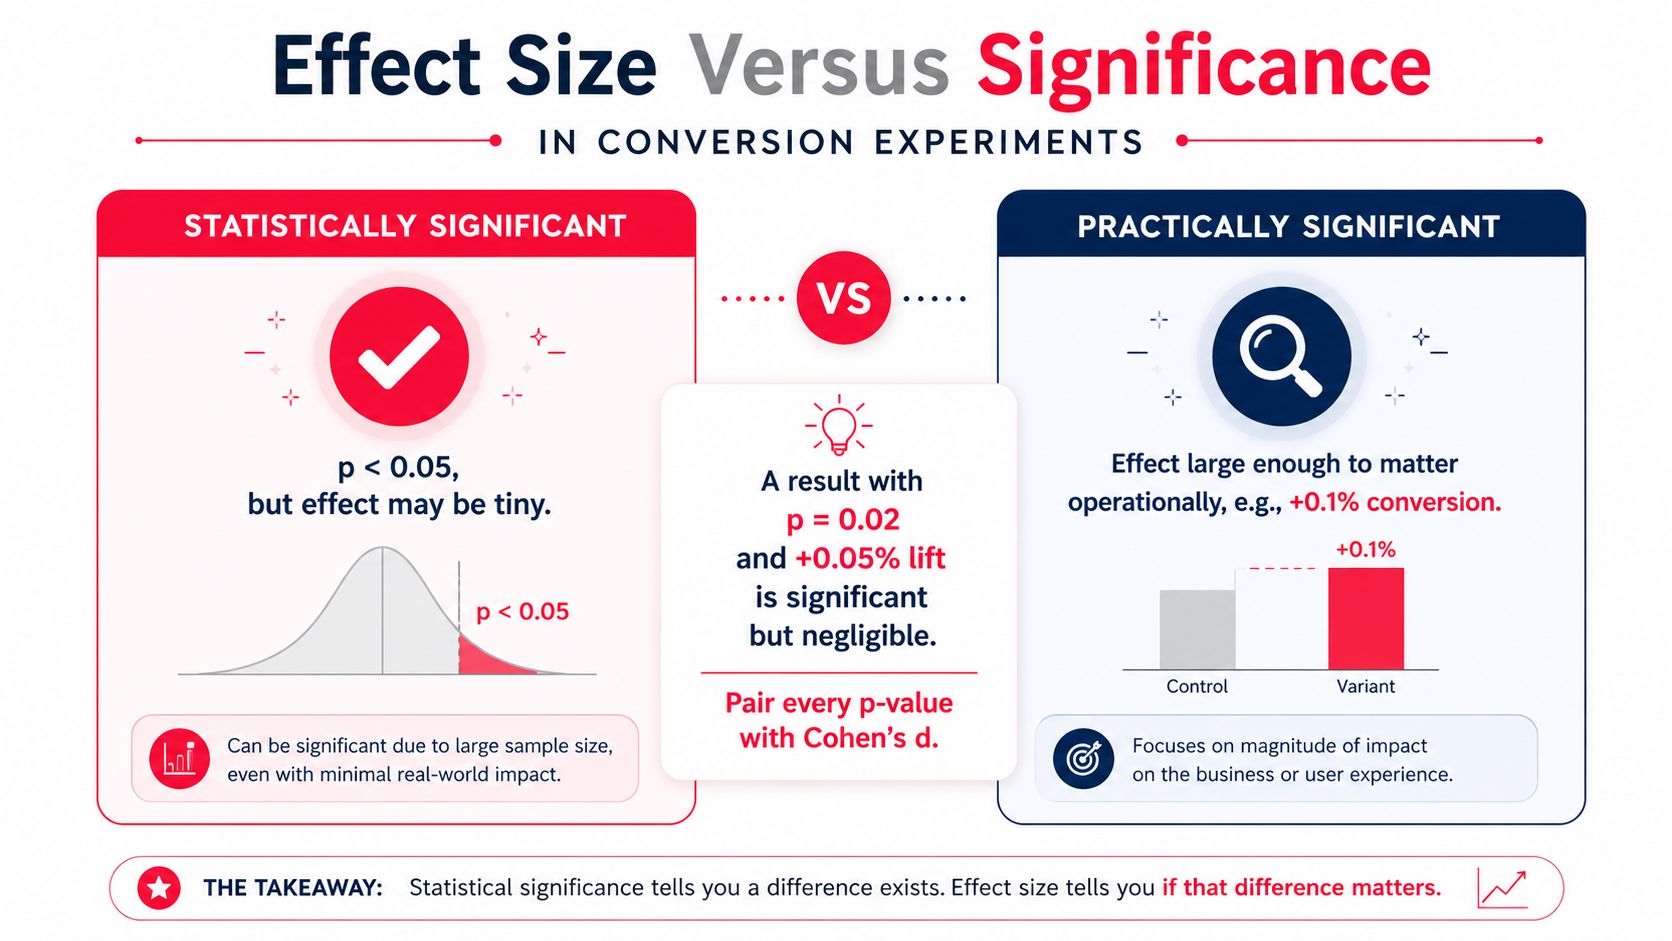
The core mistake in many SaaS and e-commerce tests is reading significance before reading effect size. A tiny lift can become significant when sample size is huge. A big lift can fail to reach significance when the test is small or noisy. Both outcomes are common.
For a pricing page test, imagine a headline change that moves conversion from 4.00% to 4.05%. That is a real difference, but the operational question is whether the lift justifies design time, QA, analytics work, and downstream support. If the page already converts well, a tiny increase can look elegant in a dashboard and still be economically irrelevant.
The same logic applies to checkout. A one-step simplification may create a larger lift, but if the sample is sparse, the test can stay inconclusive for a long time. That doesn't mean the idea is weak. It means the experiment may be too small for the effect size you care about.
Decision rule: pair every p-value with an effect size view, such as absolute lift, relative lift, or a standardized measure like Cohen's d.
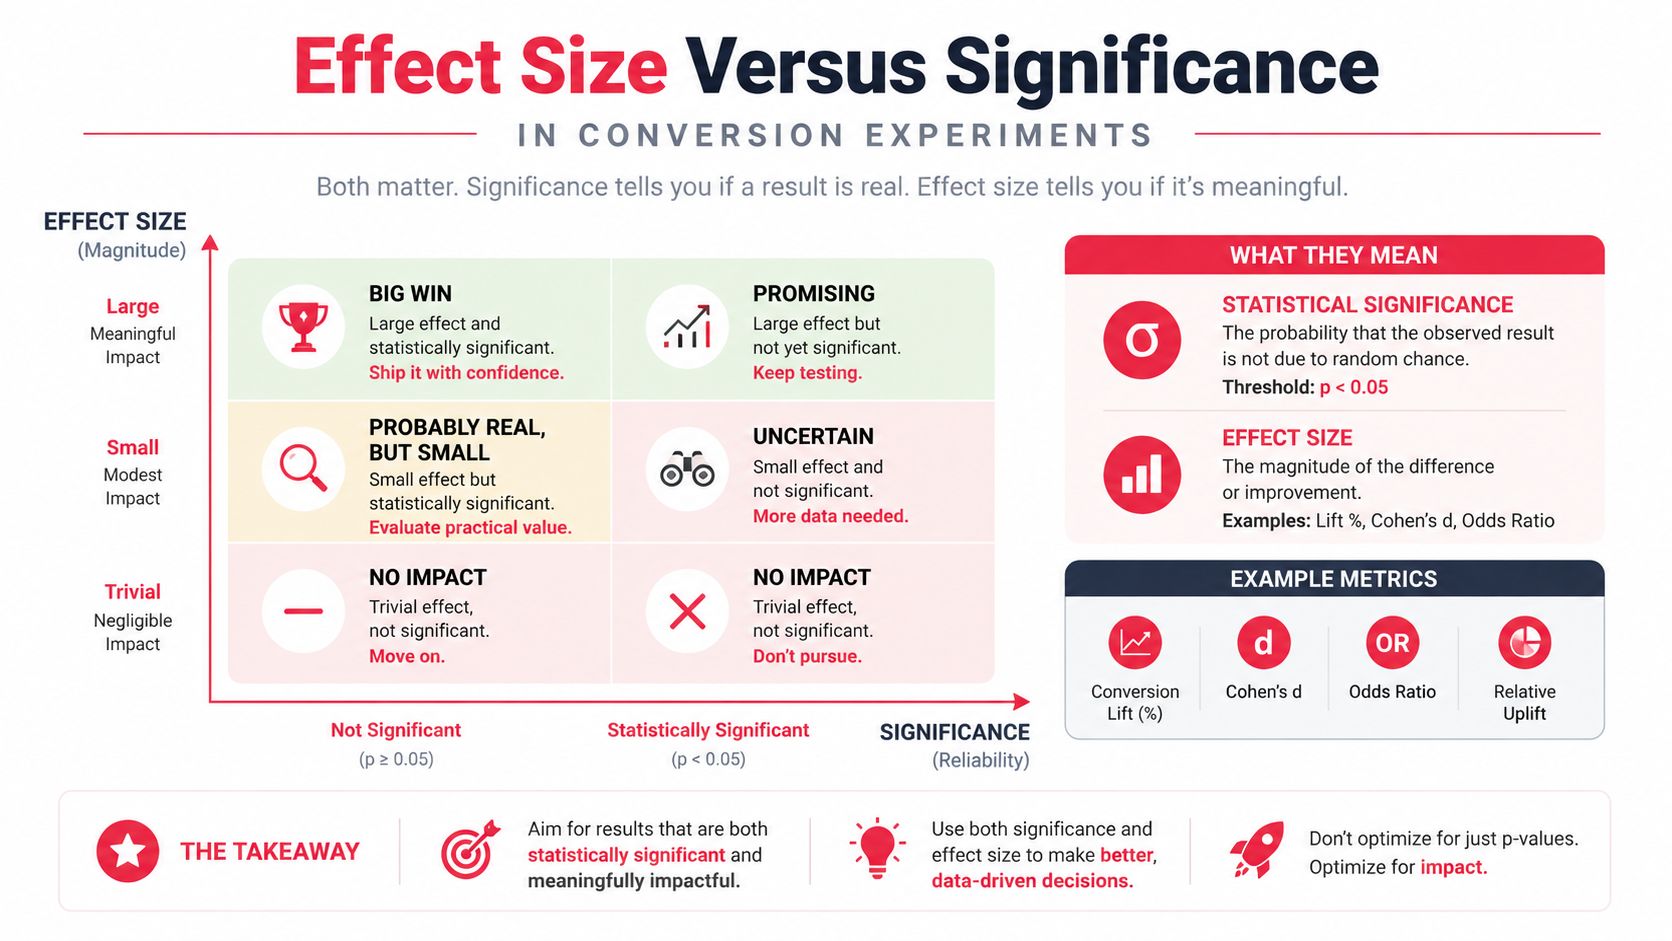
For a practical workflow, ask three questions in order. What changed in absolute terms. What changed relative to baseline. What would this mean after implementation costs, opportunity cost, and risk to the funnel. That is the analysis that keeps a CRO program honest.
If you want a tactical lens on page-level testing, the internal note on split testing landing pages is the right companion. It fits the same reality. Some lifts are real, but too small to matter. Others are economically meaningful even when the p-value story is messy.
The point is simple. A business doesn't ship p-values. It ships revenue effects. The experiment output has to survive that translation.
Sample Size and Statistical Power for Marketing Tests
A lot of tests that “fail” were already set up to fail before launch. The team wanted a meaningful lift, but the sample was too small to detect it. That is why power belongs in planning, not in postmortems.
Statistical power is the chance of rejecting the null when it is false. In practice, the reason to care is simple, weak tests waste time, effort, and budget, as noted by Carlisle Rainey. Power depends on the size of the effect you want to detect, so sample planning starts with the smallest effect that would matter to the business. If the test cannot detect that effect, it is underbuilt from day one.
A simple planning sequence works well:
- Set the baseline conversion rate. Use the established page or funnel baseline, not a guess.
- Choose the minimum detectable effect. Decide what lift would justify action.
- Pick a power target. Many teams use 80% as a planning standard, which is a common rule of thumb in power analysis discussions.
- Estimate the required sample. If the traffic does not support it, change the test design or expect a longer run.
A B2B site with around 5,000 monthly visitors usually needs patience or bolder changes. An e-commerce store with far more traffic can test smaller deltas faster, but only if the measurement discipline is tight. Low-traffic pages need either a longer window or a more dramatic change, because the noise floor is high.
The most useful habit is to treat sample size as a gate before build work starts. That is the core reason power analysis helps growth teams. It keeps the team from spending weeks on a test that could not possibly answer the question.
For a practical marketing framing, the statistical analysis for marketing tests piece is a useful external reference. Internally, the quick-start guide to conversion rate optimization pairs well with that mindset, because it forces the discussion back to business-relevant thresholds.
| Baseline Conversion Rate | 10% Relative Lift | 20% Relative Lift | 50% Relative Lift |
|---|---|---|---|
| Low baseline | Smaller absolute change, harder to detect | More visible change, easier to measure | Large enough to stand out quickly |
| Moderate baseline | Still easy to miss without enough traffic | Often more practical to detect | Usually obvious if the sample is stable |
| Higher baseline | Tiny absolute change, high sample demand | Better balance of detectability and value | Often large enough to evaluate faster |
Common Pitfalls That Destroy Test Validity
The fastest way to corrupt an experimentation program is to let the dashboard steer the test. Teams peek early, stop on good news, and call it rigor. It isn't. That behavior inflates false confidence and turns a test system into a story generator.
P-hacking takes many forms. Someone stops the test when the result first looks positive. Someone else changes the metric after seeing the trend. A third version adds another variation because the first two were underwhelming. All of that weakens trust in the result.
Multiple comparisons are just as dangerous. If you test many metrics or many variants, a nominal 5% false positive rate on one test can snowball into a much noisier decision environment when the team is checking lots of outcomes and making lots of choices. That problem grows faster when AI tools produce more variants and more test ideas.
Operational fix: lock the primary metric, set the stop date in advance, and review secondary metrics only after the main readout.
The countermeasures are familiar because they work. Use fixed-horizon tests. Pre-register the main hypothesis. Apply multiple-comparison correction when you're testing many outcomes or variants. Bonferroni is conservative. Benjamini-Hochberg is often more practical when discovery matters and the team can tolerate some false discoveries. The right choice depends on risk and decision cost.
If you're shipping AI-generated test ideas at high velocity, discipline matters more, not less. The more tests you run, the easier it is to fool yourself with an accidental winner. That is why serious programs keep a written rule for what counts as a valid win before the test starts.
Confidence Intervals and Bayesian Alternatives to P-Values
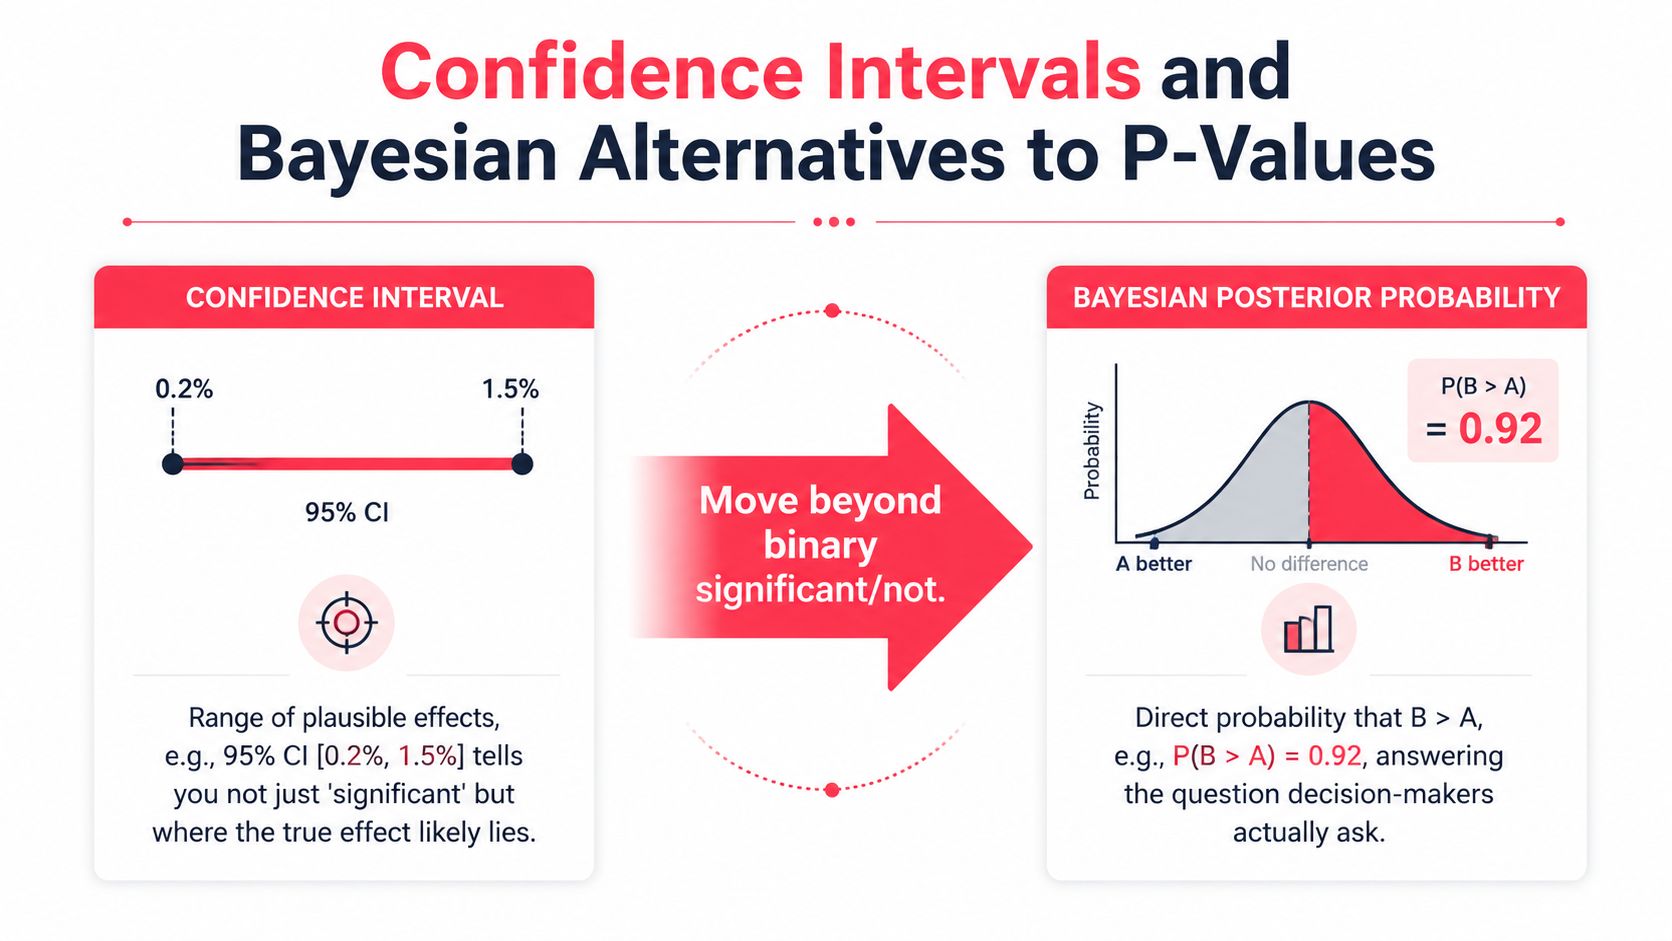
A p-value gives a binary-ish read, but leaders usually need a range. Confidence intervals do that job better. They show the plausible span of the effect, which is far more useful than a yes-or-no label when you're deciding whether to ship.
A confidence interval helps answer a practical question. Is the effect likely tiny, moderate, or large enough to matter. That range matters because a statistically significant result can still sit in a zone where the business impact is negligible. The effect estimate alone is never enough.
Bayesian reporting gives another useful lens. Instead of asking whether the data are unlikely under the null, it asks for the probability that B is better than A under the model assumptions. That's closer to how executives talk about decisions. They want to know what's more likely to be true, and how much they should trust it.
For teams that want a deeper treatment, the insights from Sovran are worth a read because the confidence interval framing is practical and decision-friendly. It fits well when you're comparing variants in a live growth program and need to explain the range, not just the label.
The clean comparison looks like this:
- P-value: good for testing compatibility with the null.
- Confidence interval: good for reading the likely size and direction of the effect.
- Bayesian posterior probability: good for expressing decision probability under explicit assumptions.
Each approach has a place. If your org already runs fixed-horizon experiments with strict governance, frequentist workflows can stay clean and simple. If you want continuous experimentation with clear decision probabilities, Bayesian methods can feel more natural. The key is consistency. Pick one framework, document it, and make sure the team knows how to act on it.
Embedding Significance Into AI-Driven Experimentation Workflows
AI can speed up experimentation, but it can also speed up bad habits. The fix is a workflow that forces every test through the same gates before anything ships.
The checklist is straightforward. Register the hypothesis. Choose one primary metric. Set the sample plan before launch. Define the effect size threshold that would justify change. Apply correction rules when multiple variants or metrics are in play. Validate revenue after the test, because a winning click-through rate can still lose downstream value.
That workflow belongs inside the agentic system itself. If an AI agent proposes tests, it should also check the power plan, flag missing baselines, and refuse to promote a result that only looks good because someone peeked early. The same logic applies to AI A/B testing. Velocity only helps when the guardrails are real.
My audit habit is simple. Take the last ten tests, review each one against the checklist, and mark which ones would have been stopped, extended, or shipped differently. That exercise usually exposes the weak spots fast. It also gives your team a clearer standard for the next round of CRO, GTM engineering, AI search optimization, and agent commerce work.
If you want help turning your experimentation process into a revenue-grade operating system, book a working session with Stimulead and we'll review your last ten tests, your current decision rules, and where AI can safely increase testing velocity without increasing false positives.